Sports Analytics · Business Intelligence

Declan
Davis

Business Analytics & Sports Management student turning raw data into actionable insights — building tools with Python, SQL, and Power BI at the intersection of sports and data science.

View Projects ↓ GitHub Profile 𝕏 @declandavis17
Declan Davis
Business Analytics
Sports Management
Python SQL MySQL Power BI DAX Web Scraping Data Modeling Sports Analytics Business Intelligence Python SQL MySQL Power BI DAX Web Scraping Data Modeling Sports Analytics Business Intelligence
01 // Business Intelligence
Power BI · Dashboard
Celtics Ticketing Intelligence Dashboard

Multi-page Power BI dashboard analyzing fan behavior, ticketing, and social media data using MySQL and DAX.

Power BIMySQLDAX
Read More ↓
SQL · Tableau · Dashboard
Celtics Home Game Demand Analysis

Built a proxy Game Attractiveness Score using SQL and Tableau to analyze scheduling and opponent factors driving home game demand.

SQLTableauG.A.S
Read More ↓
02 // Basketball Analytics
Python · Predictive Model
NBA PPG Predictor

Python-based scoring predictor using live web-scraped stats from Basketball-Reference with home/away adjustments.

PythonWeb ScrapingML
Read More ↓
Python · RAG · LLM Agent
NBA Analytics RAG Agent

A retrieval-augmented generation agent that answers plain-English NBA questions grounded in real 2025-26 season data via Claude.

Claude APITF-IDFStreamlit
Read More ↓
Python · Film Analytics
College Basketball Shooting Profile

Tracked and analyzed 112 of my own shot attempts from film — location, play type, contest level — to uncover my true shooting profile.

PandasPlotlySelf-Scouting
Read More ↓
Business Intelligence — Case Studies
Business Intelligence · 01 · Power BI · Dashboard

Celtics Ticketing
Intelligence Dashboard

A multi-page analytics dashboard built with synthetic sports data

↗ View on GitHub
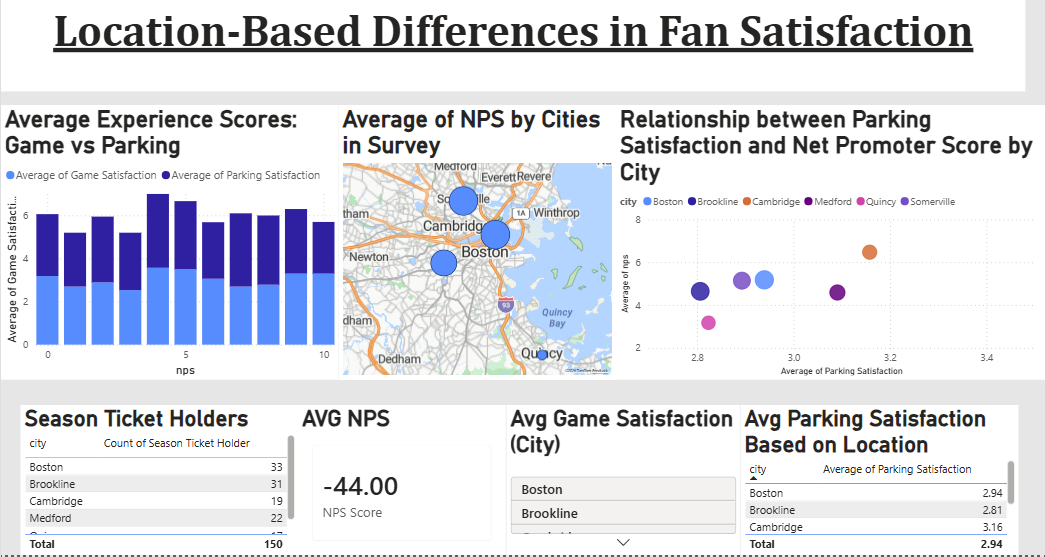
Location Satisfaction Dashboard
📊 Location & Satisfaction Dashboard
Opponent Impact Dashboard
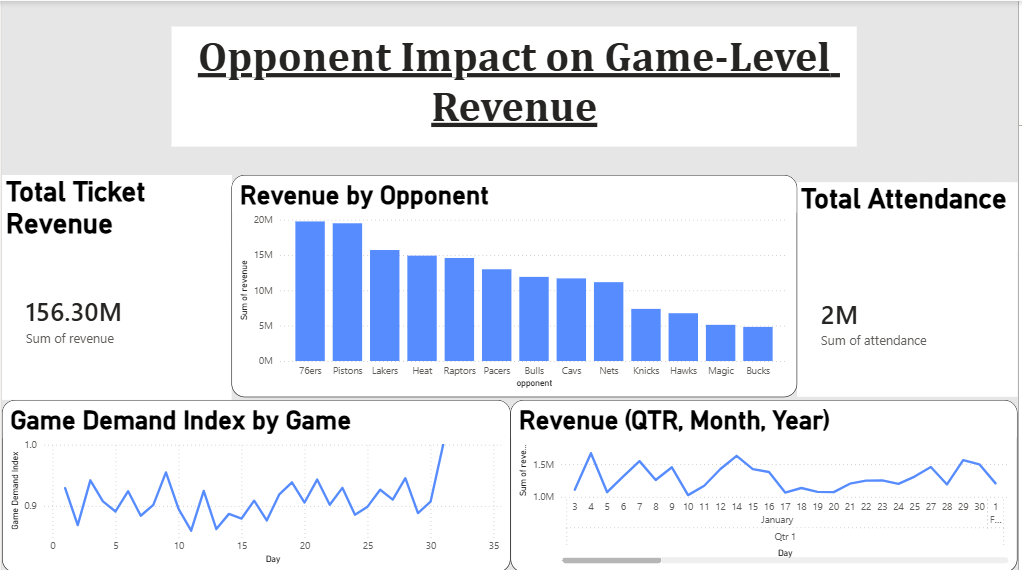
📊 Opponent Impact Dashboard
Social Engagement Dashboard
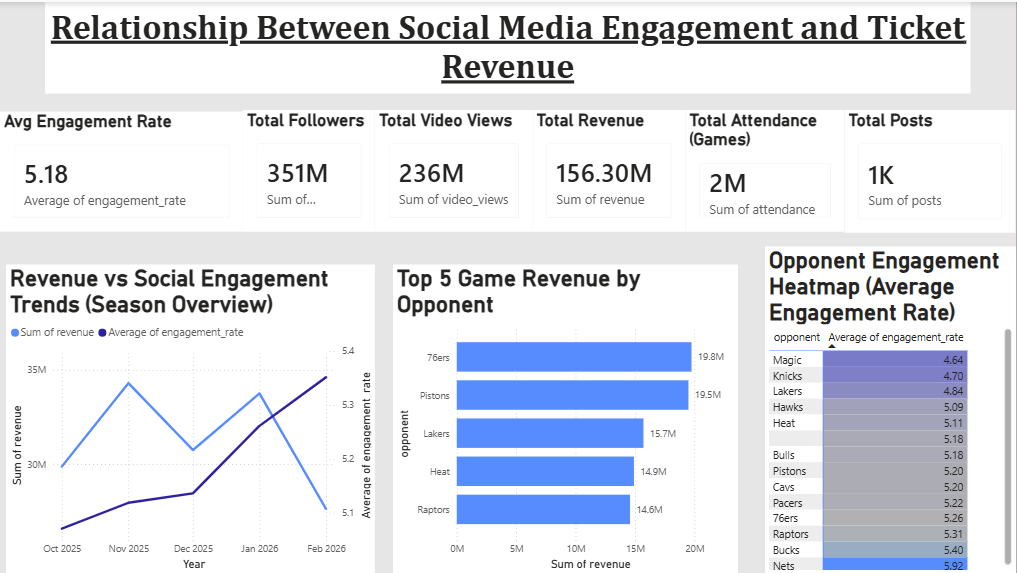
📊 Social Engagement Dashboard

A multi-page Power BI analytics dashboard using AI-generated ticketing, social media, and fan survey data. Used modeled datasets in MySQL, SQL joins, and DAX measures to analyze relationships between fan engagement, revenue, and game demand — replicating how a professional sports organization might approach business intelligence.

📊  Data Creation  →  SQL Database  →  SQL Joins & Queries  →  Dashboard Design  →  Overall Insights
Step 1 Data Generation

Used AI to generate synthetic data of realistic fan datasets. Four CSV files with 100+ rows each:

fans.csv
Name · Age · City · Email · Fan_ID · Season Ticket Holder
social_metrics.csv
Date · Engagement Rate · Followers · Posts · Video Views
survey.csv
Fan_ID · Game Satisfaction · NPS · Parking Satisfaction · Comments
ticket_sales.csv
Game_ID · Attendance · Date · Opponent · Ticket Sales
Step 2 SQL Database

Datasets were created into a MySQL database to ensure all data was isolated in a structured schema. Two tables were designed to support ticketing and social analytics:

Database & Table Creation
CREATE DATABASE IF NOT EXISTS ticketing_analytics;
USE ticketing_analytics;

CREATE TABLE social_metrics (
    date             DATE,
    followers        INT,
    engagement_rate  FLOAT,
    posts            INT,
    video_views      INT
);

CREATE TABLE ticket_sales (
    game_id   INT PRIMARY KEY,
    date      DATE,
    opponent  VARCHAR(100),
    attendance INT,
    revenue   FLOAT
);
Why this Works
--> Explicit data types ensure clean modeling
--> game_id acts as a primary key
--> date serves as the relational join key between ticket and social data
--> This structure mimics how professional sports organizations store event-level data
Step 3 Data Ingestion

CSV files were directly imported into MySQL:

ETL — Load Data
LOAD DATA INFILE '.../social_metrics.csv'
INTO TABLE social_metrics
FIELDS TERMINATED BY ','
ENCLOSED BY '"'
IGNORE 1 ROWS;

LOAD DATA INFILE '.../ticket_sales.csv'
INTO TABLE ticket_sales
FIELDS TERMINATED BY ','
ENCLOSED BY '"'
IGNORE 1 ROWS;
What this Shows
--> Basic ETL (Extract, Transform, Load)
--> Structured data ingestion
--> Preparing analysis-ready relational tables
Step 4 SQL Joins & Queries

To analyze the relationship between digital engagement and ticket performance, a relational join was performed:

SQL Join — Engagement vs Revenue
SELECT
    t.date,
    t.opponent,
    t.attendance,
    t.revenue,
    s.engagement_rate,
    s.video_views,
    s.posts
FROM ticket_sales t
JOIN social_metrics s
    ON t.date = s.date;
What this Join Achieves
--> Aligns game-day revenue with social engagement metrics
--> Enables direct correlation analysis
--> Produces a unified dataset for Power BI modeling
--> Reduces transformation complexity inside the BI layer
Disclaimer: The Fan and Survey datasets were imported directly into Power BI as CSV files. The Social Media and Ticket Sales datasets were intentionally processed in MySQL to demonstrate SQL database design, table creation, data ingestion, and relational joins prior to BI modeling. This approach allowed me to showcase both SQL data engineering skills and Power BI analytics development within the same project.
Insights Overall Insights
--> Rivalry games drive the most revenue — 76ers and Pistons matchups generated the highest ticket revenue (~$20M each) and also had among the highest social engagement rates, making them the most valuable nights commercially and digitally
--> Social engagement and revenue move inversely — revenue peaks early then declines, while engagement rate trends upward toward season's end — the disconnect may be worth exploring for future marketing timing
--> Parking satisfaction is dragging down NPS — overall NPS of -44 is significantly negative, with a clear relationship between parking satisfaction and NPS scores across cities — the clearest area for operational improvement
--> Cambridge fans are the most satisfied with parking (3.16 avg) despite being a smaller season ticket group (19 holders) — a potential conversion opportunity

Tools & Technologies

Power BI MySQL DAX SQL Joins ETL Data Modeling AI Synthetic Data
Business Intelligence · 02 · SQL · Tableau

Celtics Home Game
Demand Analysis

Exploring scheduling and opponent factors that influence fan interest in home games

↗ View on GitHub
Celtics Home Game Demand Dashboard
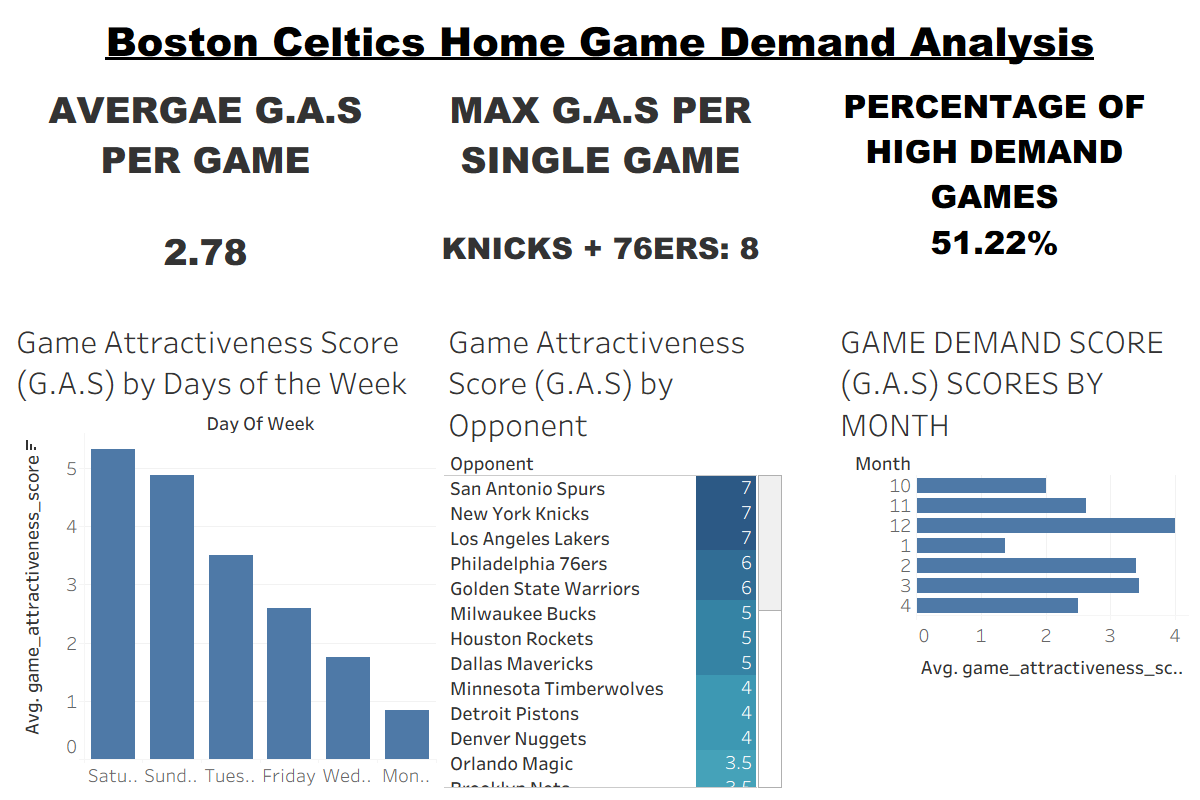
📊 Celtics Home Game Demand Dashboard

This project explores how scheduling and opponent factors influence fan interest in Boston Celtics home games. Using SQL for data preparation and Tableau for visualization, the goal is to uncover patterns in demand and demonstrate how data can support decision-making in sports business operations.

📊  Data  →  SQL Database  →  SQL Cleaning  →  Dashboard Design  →  Overall Insights
Step 1 Data

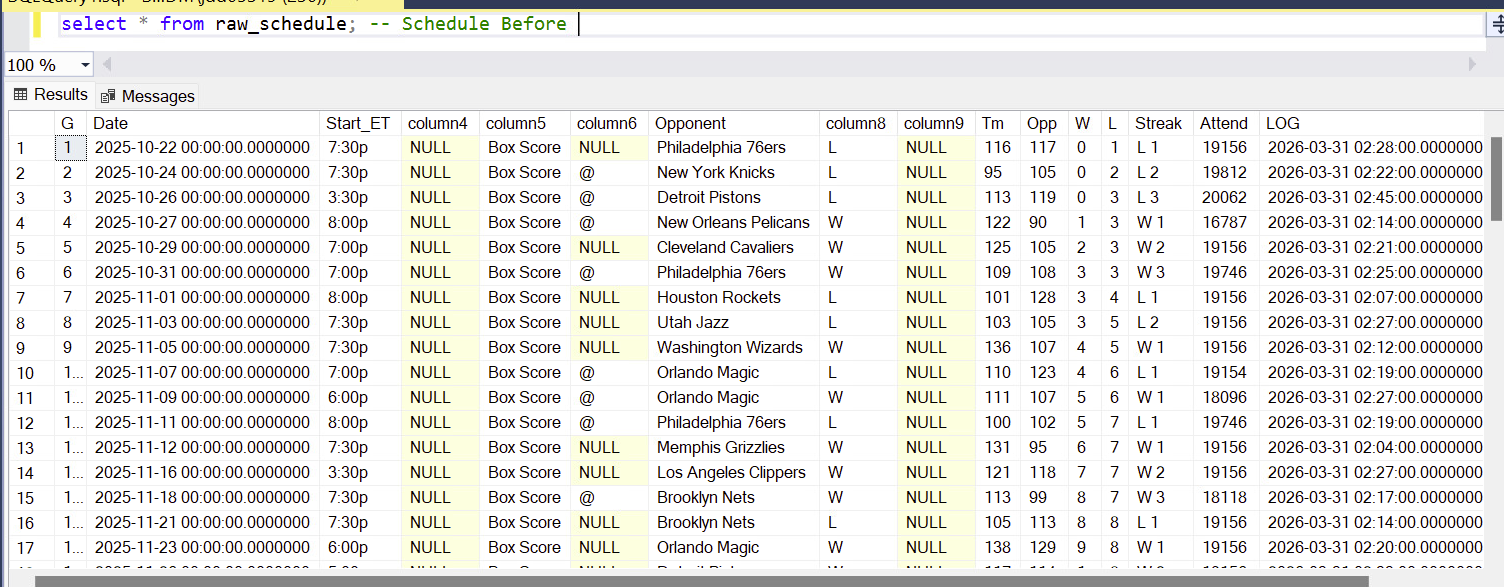
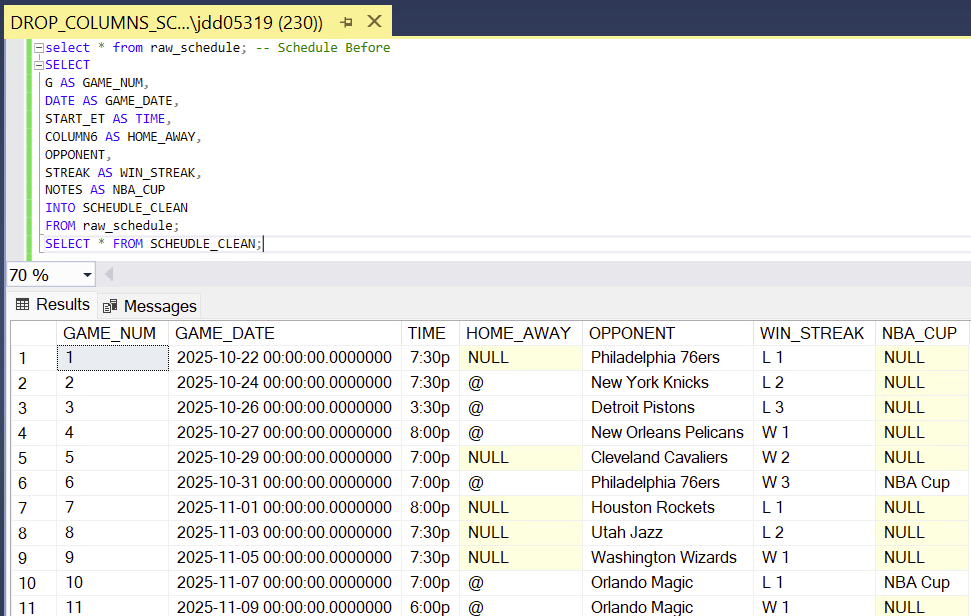
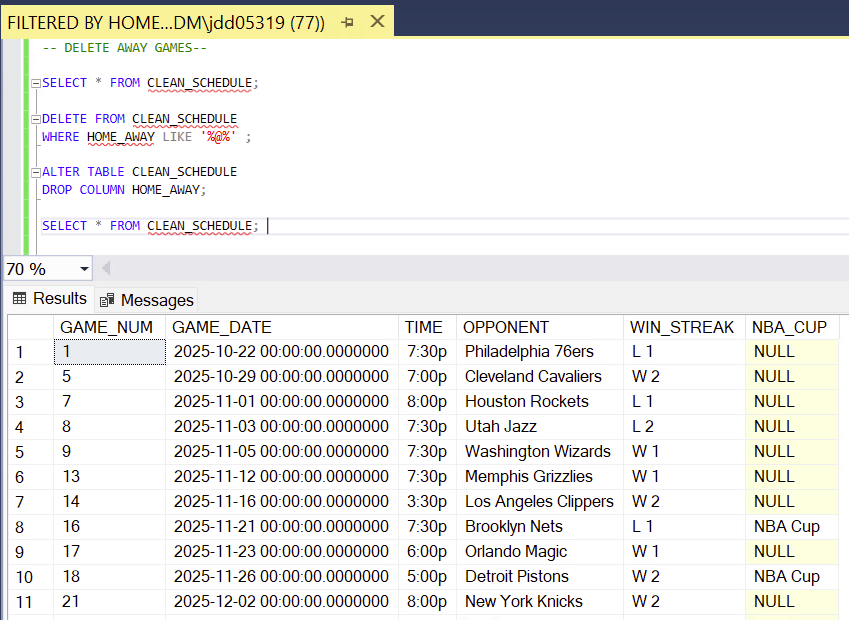
The dataset was sourced from Basketball Reference and includes Celtics game schedule information. Data was cleaned and structured in SQL, with key fields including game number, opponent, game timing, and indicators such as home/away and special event games. The dataset was filtered to focus on home games only.

Data Before Cleaning (CSV)

Schedule Before Cleaning
Step 2 SQL Cleaning

1. Drop Unwanted Columns

Dropped Tables

2. Filtered Home Games

Filtered Home Games

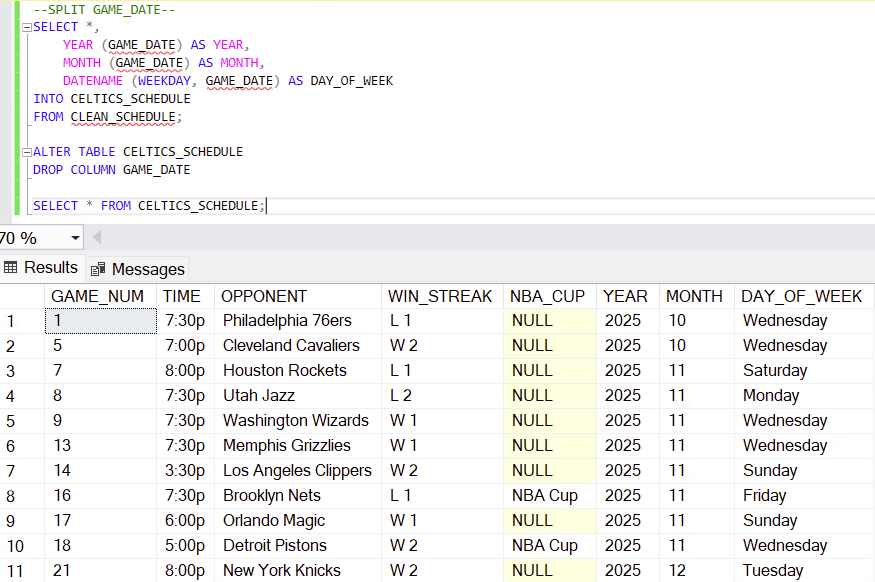
3. Split Date Column

Split Date Query
Step 3 Game Attractiveness Score (G.A.S)

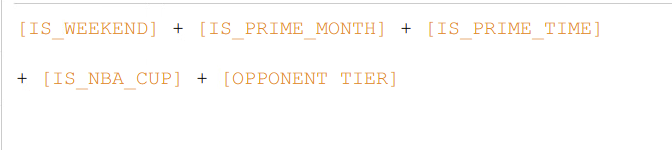
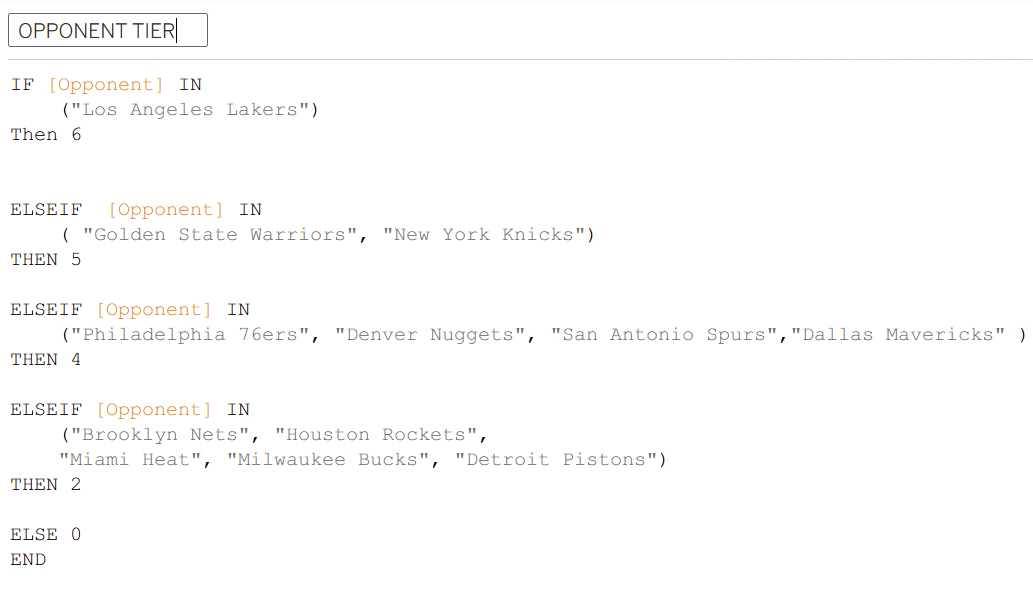
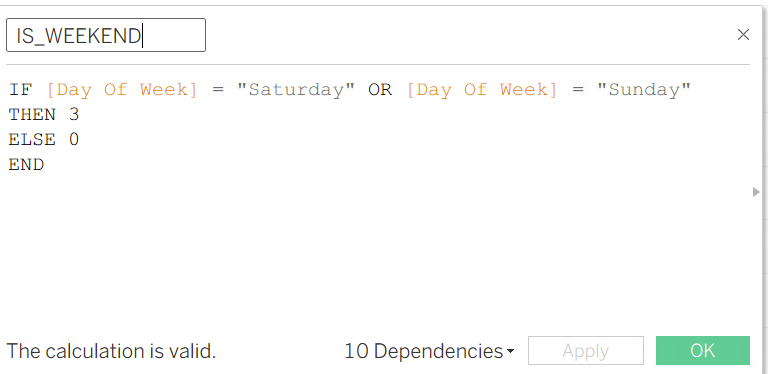
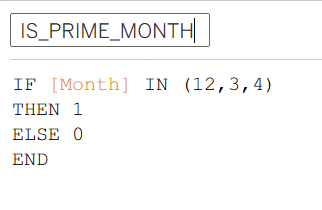
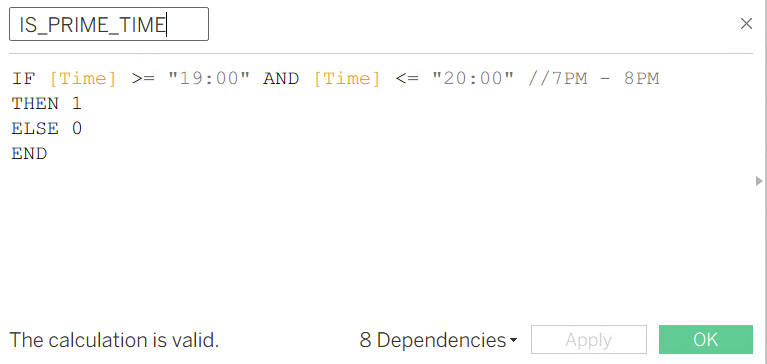
A custom "Game Attractiveness Score" (G.A.S) was developed as a proxy for demand due to limited attendance variability in the dataset. The score assigns weighted values based on key demand drivers including weekend games, marquee opponents, and special game contexts.

Attractiveness Score Formula

Attractiveness Score

Scoring Metrics

Opponent Tier
Opponent Tier
Is Weekend
Weekend Flag
Prime Month
Prime Month
Prime Time
Prime Time
Insights Overall Insights
--> Weekend and prime matchups drive highest demand — scheduling on weekends with marquee opponents significantly elevates the Game Attractiveness Score
--> Opponent strength is a key driver of fan interest — rivalry and high-profile opponents consistently generate higher expected demand
--> Demand varies across the season based on scheduling — prime months show noticeably higher engagement patterns than off-peak periods
--> Weekday games generally show lower engagement — consistent across the dataset regardless of opponent quality
Limitations Limitations & Future Work
Current Limitations
--> Uses a proxy metric (G.A.S) rather than actual ticket sales or attendance data
--> Dataset is limited to schedule-level information — no pricing, resale activity, or customer segmentation
--> Model estimates demand based on assumed drivers rather than direct measurement
Future Work
--> Develop a "rest/anticipation" metric — longer gaps between home games may lead to higher fan anticipation
--> Integrate real ticketing or CRM data (tickets sold, revenue, resale prices) to validate and enhance the proxy model
--> Incorporate fan segmentation, promotional effectiveness, and predictive modeling

Tools & Technologies

SQL Tableau Basketball-Reference Game Attractiveness Score Data Cleaning Sports Business Analytics
Basketball Analytics — Case Studies
Basketball Analytics · 01 · Python · Predictive Model

NBA Points Per
Game Predictor

A live data-driven model for predicting NBA player scoring output

↗ View on GitHub
Research Question

Using online data from Sports Reference, can there be a model that accurately predicts an NBA player's Points Per Game on any given night during the NBA season?

Step 1 Data Pipeline
📊  Websites Used  →  Formula Creation  →  Data Collection & Functions  →  Overall Insights

Found player and team statistics from Sports Reference for the model:

Team Statistics
basketball-reference.com/leagues/NBA_2026.html — Defensive & Offensive team ratings
Player Statistics
basketball-reference.com/leagues/NBA_2026_per_game.html — Individual per game stats
Tools Used
--> Python
--> Pandas (pd)
Step 2 Prediction Formula
Formula Components
--> Home Court Factor: Home +1 point · Away -1 point
--> Defensive Rating Adjustment: (Opp DRtg - League Avg DRtg) × (Player PPG / Team PPG)
--> Final Forecast: Sums base PPG + DRtg adjustment ± Home Court Factor
Final Formula
Predicted_PPG = Current_PPG - (DRtg_ADJ) +/- (Home Court Factor)
Step 3 Data Collection & Functions

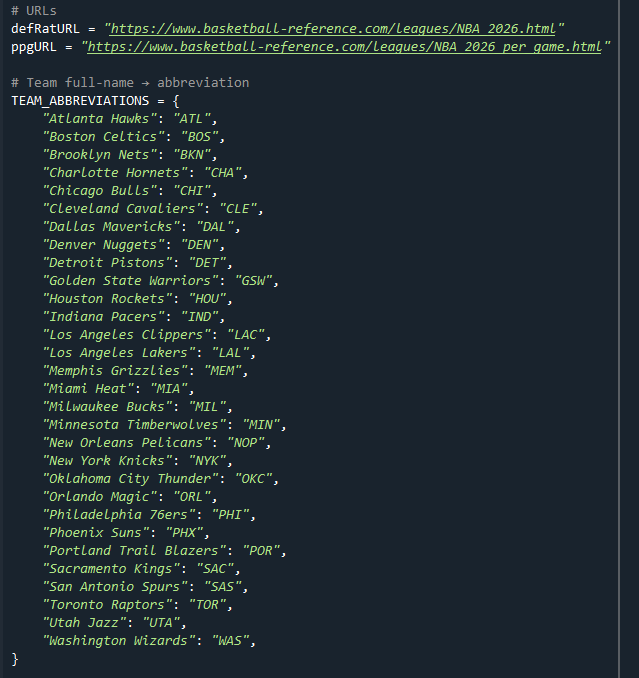
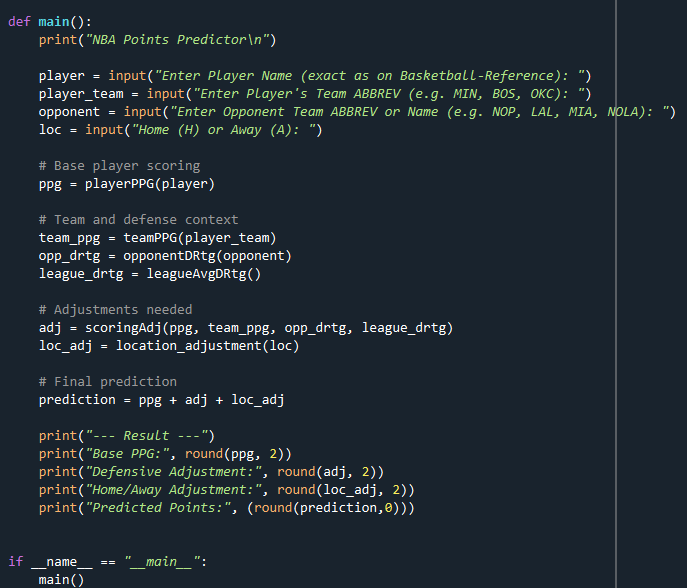
Built guided user parameters so the model accepts a player name, team abbreviation, and game location (Home or Away). Live web scraping pulls Team PPG, Individual PPG, and Team Defensive Rating directly from Basketball-Reference.

Abbreviation Dictionary

Abbreviation Dictionary

Main Function

Main Function
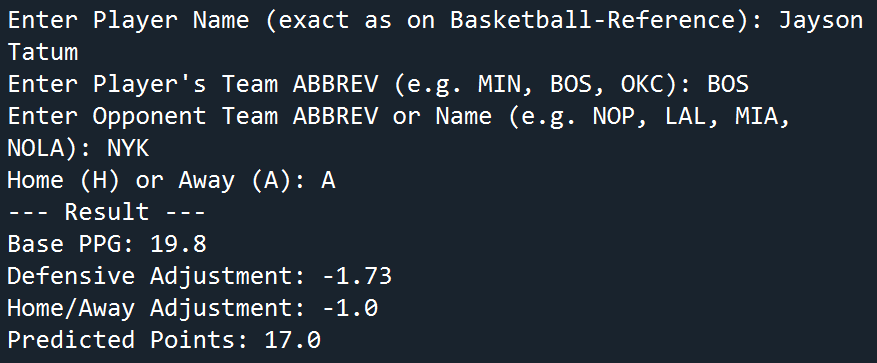
Example Example Prediction
Example Prediction
Insights Overall Takeaways
--> Context beats raw metrics — Defensive Rating and proportional scoring share significantly influence predicted PPG, but player output is heavily dependent on usage rate, game pace, matchup-specific schemes, and teammate availability. Quantitative metrics alone are insufficient without situational context.
--> Model simplicity vs. real-world complexity — A simple formula using Player PPG, Team PPG, and Team DRtg can generate reasonable directional predictions, but basketball is non-linear. Small inputs can have unpredictable effects and external variables like fatigue, injuries, and rotations are not captured.
--> Value of modular code design — Breaking the project into modular Python functions improved readability, made debugging easier, and allowed for flexible updates. Building modular functions was a highly beneficial experience for overall Python development.
Limitations Limitations & Next Steps
Current Limitations
--> Limited feature set: Only incorporates PPG, Team PPG, Defensive Rating, and location. Key metrics like usage rate, eFG%, and minutes played are excluded
--> Web scraping reliability: Depends on live Basketball-Reference data — any site structure changes can break the pipeline
--> Small sample bias: Per-game stats can be misleading for players with limited minutes or small sample sizes
Final Statement: While the model provides a structured approach to predicting PPG, it highlights that basketball performance is influenced by a wide range of dynamic and contextual factors beyond basic statistical inputs. This project also served as my first experience building modular functions in Python — a great introduction to how powerful and flexible Python can be for data analysis and modeling.

Tools & Technologies

Python Pandas Web Scraping Predictive Modeling Basketball-Reference Modular Functions
Basketball Analytics · 02 · Python · RAG / LLM Agent

NBA Analytics
RAG Agent

A retrieval-augmented generation system for querying the 2025-26 NBA season in plain English

↗ View on GitHub ▶ Live Demo
User Question TF-IDF Search 74 chunks · 9 docs top 5 retrieved Claude reads passages writes grounded answer Cited Response source document + date You get answer
🏀 The model never answers from memory — every stat it cites comes directly from the retrieved documents

Instead of manually digging through stat tables, this agent lets you ask plain-English questions and get answers grounded in real data — searching across 9 Basketball Reference datasets, retrieving the most relevant chunks, and using Claude to generate a cited, structured answer.

  • "Who is the most efficient scorer under 25?"
  • "Compare OKC and Denver — offense vs defense?"
  • "Which team shoots the most 3s and how efficiently?"
  • Step 1 Knowledge Base

    Nine Basketball Reference datasets, embedded directly as structured text — no external database or file reads required.

    Document Coverage
    Player Per-Game StatsPPG, RPG, APG, FG%, 3P%, FT% — Top 75
    Player Advanced StatsPER, VORP, BPM, WS, TS% — Top 75
    Player Adjusted ShootingFG+, TS+, eFG+ (league-adjusted) — Top 75
    Player Shooting by DistanceZone-by-zone FG% breakdown — Top 75
    Player Per-36 StatsPace-neutral production — Top 75
    Player Play-Type & On-OffPositional role, OnCourt +/- — Top 75
    Team Advanced MetricsORtg, DRtg, NRtg, Pace, SRS — All 30
    Team Per-Game StatsPTS, FG%, 3P%, REB, AST, STL — All 30
    Team Shooting by DistanceShot zone % and FG% — All 30
    Step 2 Retrieval Layer
    How Retrieval Works
    --> Every document is split into 74 chunks across the 9 datasets
    --> A scikit-learn TF-IDF vectorizer scores each chunk against the user's question
    --> The top 5 most relevant passages are pulled and passed to Claude as context
    --> NumPy handles recency scoring so the most current data is favored
    Step 3 Grounded Generation

    Claude reads only the retrieved passages — never its own training memory — and writes a structured, cited answer referencing the source document and date for every stat it uses.

    Why It Matters Why RAG over a Raw LLM Call
    --> No hallucinated stats — grounding every answer in retrieved passages keeps the model from guessing at numbers it doesn't actually have
    --> Traceable answers — every response cites the exact source document and date, so the user can verify the claim
    --> Scales to new data — updating the knowledge base doesn't require retraining a model, just refreshing the source text

    Tools & Technologies

    Python Streamlit Anthropic Claude API scikit-learn TF-IDF NumPy RAG Architecture
    Basketball Analytics · 03 · Python · Film Analytics

    My Own College Basketball
    Season Shooting Profile

    Turning a season of film study into a data-driven shooting profile

    ↗ View on GitHub
    40.4% Catch & Shoot 22.2% Shot Fake 30% Corner Three ~38% Season Avg 50%+ Set Play <38% Freelance 43.7% Pin Down 3
    📊 Key shot-profile percentages across 112 tracked possessions

    After finishing my third college basketball season, I wanted to take a deeper look at the types of shots and offensive opportunities I received throughout the year. Our team uses Synergy Sports Technology to review film, which tags shot types like "Spot-Up" or "Cut" — but I wanted to go a step further and understand not just what shot I took, but how and where I got it, the offensive context around it, and the quality of the look. From a player-development standpoint, this let me identify strengths, weaknesses, and where I could improve.

    Step 1 Film Breakdown

    Reviewed all 112 offensive possessions in which I shot the ball, manually tracking six categories per shot:

    Origin
    Set Play · Freelance · Transition
    Play Type
    Pin Down · Space · Ball Screen · DHO · Zoom · Cut · Isolation
    Shot Location
    Wing Three · Corner Three · Slot · Elbow · Short Corner · Deep Paint · Restricted Arc
    Shot Type
    Catch & Shoot · Off Dribble · Fadeaway · Layup · Shot Fake
    Contest Level
    High · Medium · Low
    Result
    Make · Miss · Fouled
    Step 2 Python Analysis

    Built two reusable functions — one to summarize shot data by any grouping column, and one to plot a grouped bar chart of shot percentage with Plotly Express. Reused across every chart in the script.

    summarize_shot_data()
    def summarize_shot_data(df, group_col):
        """
        Summarizes shot data by the given grouping column(s),
        calculating total shots, made shots, and make percentage.
        """
        summary = (
            df.groupby(group_col)
            .agg(
                total_shots=('result', 'count'),
                made_shots=('result', lambda x: (x == 'Make').sum()),
                shot_percentage=('result', lambda x: (x == 'Make').mean() * 100),
            )
            .reset_index()
        )
        summary['shot_percentage'] = summary['shot_percentage'].round(1)
        return summary.sort_values(by='shot_percentage', ascending=False)
    plot_shot_percentage()
    def plot_shot_percentage(summary, x_col, color_col, title, palette):
        """
        Builds a grouped bar chart of shot percentage, split by
        x_col and colored by color_col. Reused for every chart.
        """
        fig = px.bar(
            summary, x=x_col, y='shot_percentage', color=color_col,
            color_discrete_sequence=palette, barmode='group',
            text='shot_percentage', title=title, template='plotly_white',
        )
        fig.update_traces(texttemplate='%{text}%', textposition='outside')
        return fig
    Cross-Sections Analyzed
    --> Shot Type × Contest Level
    --> Shot Location × Contest Level
    --> Origin × Shot Type / Location / Contest Level
    --> Shot Type × Play Type  ·  Shot Location × Play Type
    Insights Overall Insights
    --> Shot fakes need work — I shoot 40.4% catching and shooting in space, but only 22.2% off a shot fake into the closeout. Sharpening that counter could turn me from a one-trick shooter into more of a playmaker
    --> Corner threes are a weak point — across play type, contest level, and origin, corner threes sit around 30%, about 8 points below my average — a crucial fix given my role as a floor-spacing shooter
    --> Set plays outperform freelance — I shoot 50%+ within a set play versus under 38% in freelance offense. Interestingly, highly-contested freelance shots (10-26) outperform wide-open ones (5-16)
    --> Pin downs are my bread and butter — 43.7% on wing threes off a pin down, 5 points above my average — a play type worth continuing to lean on
    Note on Sample Size: 112 shot attempts is a relatively small sample, which shows up in the bar sizes throughout the charts. Even so, the patterns held up consistently on film review. I'd love to expand this to all offensive possessions (not just shots) to find where my net rating is highest on the floor, and eventually map results onto an actual court diagram.

    Tools & Technologies

    Python Pandas Plotly Express NumPy Synergy Sports Film Study
    03 // Experience
    Analytics Experience
    Business Intelligence and Operations Intern Current
    Boston Celtics · Boston, MA
    June 2026 – September 2026
    • Conducted large-scale CRM data quality audits on 1M+ records in the Data Warehouse using DBeaver and SQL, uncovering 100K+ invalid, null, or duplicate data points; implemented cross-system reconciliation logic with SQL joins to restore missing data and improve record completeness.
    • Built advanced SQL analyses using CTEs, aggregations, and comparative performance metrics to evaluate audience engagement across 500+ NBA broadcasts and identify drivers of national and local ratings performance.
    • Analyzed 500+ Season Ticket Membership cancellation responses, developing a churn-driver framework that transformed open-ended feedback into actionable business insights.
    Marketing/Statistics Intern
    The Tournament (TBT/TST) · Boston, MA
    May 2025 – Aug 2025
    • Managed and updated three large-scale data warehouses, maintaining accuracy across thousands of data points for team and league reporting.
    Business Analyst / Marketing Intern
    ShotQuality · Boston, MA
    Jan 2025 – Jun 2025
    • Managed and organized an Excel database of 400+ NBA injury records (March–June), supporting the launch of ShotQuality's injury detection software used by sportsbooks to adjust betting lines in real time.
    Additional Experience
    Financial Planning / Marketing Intern
    Raskin Planning Group · Boston, MA
    June 2025 – May 2026
    • Organized and updated client Assets Under Management (AUM) across 100+ high-profile portfolios, ensuring data accuracy for quarterly performance reviews, compliance reporting, and annual review letters.
    Leadership & Activities
    Member/Player, Captain '25-'26
    Suffolk University Basketball Team · Boston, MA
    Sept 2023 – Present
    04 // Latest Insights on X
    𝕏 @declandavis17 →

    Sharing sports data insights, charts, and analysis. Follow along for more.

    View All Posts on X →
    05 // About Me

    Building at the intersection of sports & data

    I'm Declan Davis, a Business Analytics & Information Systems and Sports Management student at Suffolk University's Sawyer Business School (anticipated May 2027) with a passion for using data to drive decisions in the sports world.

    I'm currently a Business Intelligence and Operations Intern with the Boston Celtics, and I've previously worked with The Tournament (TBT/TST) and ShotQuality. Outside of internships, I build fan intelligence dashboards and predictive scoring models for the NBA — projects that have real-world relevance in sports strategy and operations.

    My toolkit includes Python, SQL, MySQL, Power BI, DAX, and Excel — and I'm always looking for new ways to apply data science to sports problems.

    Python
    85%
    SQL
    80%
    Power BI
    75%
    DAX
    65%
    MySQL
    78%